


"Anything you want to show, you can do it... there is a lot of flexibility in
formatting... our presentation now looks more professional, more
polished"
Peter McAlenney, MFG
"We were able to get the same presentation we had with AutoCAD in much less time"
Michael Li, Parsons Engineering Science
Peter McAlenney, MFG
"We were able to get the same presentation we had with AutoCAD in much less time"
Michael Li, Parsons Engineering Science
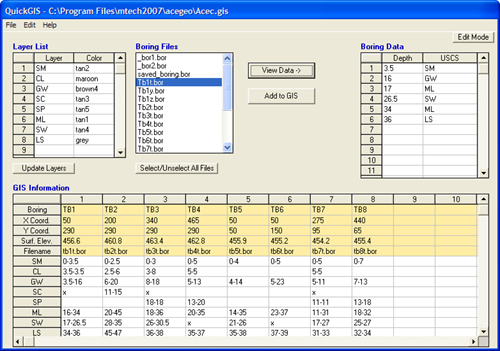
QuickGIS
In the QuickGIS editor, you open each boring file and then place its geological layer data into a table of X, Y, Z
coordinates. Once in this format, QuickGIS can export the data to a variety of modelling programs. This two step process
is necessary because human interpretation of the layers is almost always needed. Below is a sample GIS table:
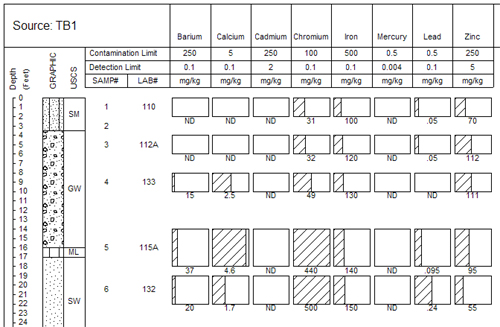
QuickSoil
QuickSoil provides a method of showing soil sample test results (not found in QuickLog). Under each column, the value
(and graph, optionally) of the parameter are shown at the depth of the soil sample. The amount of shading in
the graph is equal to the value of the parameter in proportion to its "contamination limit," a standard that you assign.
Below is a sample diagram: